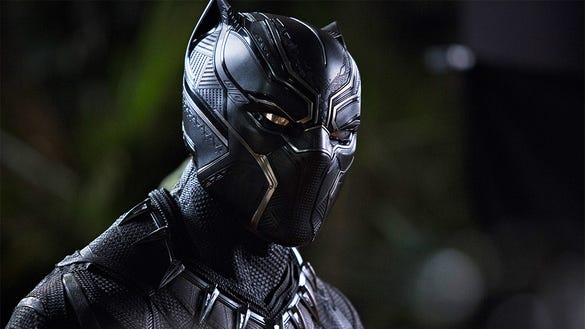
Roar of "Black Panther" not fading

TW Title (click to view) Weekend Gross % Change Theater Count / Change Average Total Gross 1 Black Panther $108,046,000 -46.5% 4,020 - $26,877 $400,000,422 2 Game Night $16,600,000 - 3,488 - $4,759 $16,600,000 3 Peter Rabbit $12,545,000 -28.3% 3,707 -18 $3,384 $71,290,702 4 Annihilation $11,000,000 - 2,012 - $5,467 $11,000,000 5 Fifty Shades Freed $6,915,000 -60.0% 3,265 -503 $2,118 $89,560,780 6 Jumanji: Welcome to the Jungle $5,650,000 -28.8% 2,519 -281 $2,243 $387,284,215 7 The 15:17 to Paris $3,600,000 -52.5% 2,752 -290 $1,308 $32,257,752 8 The Greatest Showman $3,400,000 -32.5% 1,601 -335 $2,124 $160,766,870 9 Every Day (2018) $3,103,996 - 1,667 - $1,862 $3,103,996 10 Early Man $1,700,000 -46.7% 2,494 - $682 $6,779,422 11 Three Billboards Outside Ebbing, Missouri $1,225,000 -19.1% 691 -89 $1,773 $50,129,579 12 The Post $1,200,000 -39.7% 795 -255 $1,509 $78,848,001 13 The Shape of Water $1,115,000 -32.9% 721 -236 $1,546 $55,300,844 14 Winchester $975,000 -55.8% 852 -627 $1,144 $23,780,774 15 Samson $950,000 -51.1% 1,140 -109 $833 $3,723,496


